
Quick Answer — A friabilator measures how much material a sample of tablets loses while tumbling in a rotating drum. For compressed, uncoated tablets, the harmonized procedure uses 100 revolutions at 25 ± 1 rpm. Gently remove loose dust and weigh the tablets before and after the run. Calculate the percentage lost and inspect the tablets individually. For most products the general benchmark is no more than 1.0% mass loss. An obviously cracked, cleaved or broken tablet after tumbling fails the sample even at a low percentage. [1]
Pontos principais
- Choose whole tablets by unit weight. At 650 mg or less per tablet, select a total as close as possible to 6.5 g. Above 650 mg, take ten whole tablets. Use their actual starting weight in the calculation. [1]
- Save both balance readings and the physical evidence. A chipped corner, uniform wear on every edge and a crack through one face can produce similar percentages. A photograph at receipt and a second one after tumbling preserve the distinction.
- Watch how the tablets move. A counter can register 100 revolutions while elongated cores ride together for part of the run. Check that the drum lifts and releases them, then record any method-supported change in orientation.
- Trace damage to a named sampling point. If a bin reaches coating with chipped cores, compare incoming material at the press outlet and coating inlet from the same production interval. Keep that observation alongside the laboratory result for each point.
What Is a Friabilator?
A friabilator is a bench instrument that exposes tablets to repeated rolling, falling and contact with the drum wall and with one another. A separate balance measures the initial and final mass of the whole sample. The difference, expressed as a percentage of the initial mass, is its tablet friability under the stated conditions. A sample that loses 26 mg could have shed a light film of dust from every tablet or one small piece from a single edge. Looking at the recovered units tells the analyst which description fits.
The method discussed here applies to compressed, uncoated tablets. An example on a pharmaceutical line is a core sampled after pressing and before film coating. FDA/ICH Q6A lists core friability before coating as an example of an in-process test. Breaking force supplies a separate measurement of the load needed to fracture an individual tablet in a given orientation. A core can have adequate breaking force and still lose a thin edge at a chute. Record the sampling point, product stage and applicable specification so those two results can be used together. [1] [2] [3]
Friability Test Procedure From Sampling to Final Weight
Arrange the drum, balance and transfer vessel so that every tablet can be followed from its labeled sample container to the final weighing. The following sequence describes the harmonized friability test procedure for uncoated tablets. Use the product’s approved sampling plan to determine where and when to collect material. [1]
- Identify the received material. Record the batch, sampling point, time, container and condition on arrival. Place the tablets where both faces and the band can be seen. If loose chips or broken units are already present, photograph or describe them before choosing the test portion. The condition of a delivery container is part of a handling investigation even when the prescribed test uses whole tablets.
- Select the number of whole tablets. At 325 mg, 20 tablets give about 6.5 g. At 400 mg, 16 tablets give 6.4 g, closer to the target than the 6.8 g obtained with 17. At 500 mg, take 13. At exactly 650 mg, take ten. At 750 mg, the rule for units above 650 mg applies, so ten tablets give about 7.5 g. These masses help select the count. Enter the actual measured weight on the worksheet.
- Dedust and weigh the test portion. Gently remove loose surface dust using the established method. Check the balance, weighing vessel and tare, then weigh the tablets together. Record the unrounded reading and its unit. If weighing takes place in a different room from the drum, identify who moved the sample and keep it covered as the procedure requires.
- Load the drum and check the motion. Seat the cover and select the correct speed and rotation count. Watch several turns. Tablets should lift, turn and fall. For a size or shape that prevents regular tumbling, the method describes tilting the base to about 10° from horizontal until the tablets fall freely. Confirm the setup in the approved procedure and record the orientation actually used. [1]
- Run the prescribed exposure. Complete 100 revolutions at 25 ± 1 rpm. At the nominal speed this takes about four minutes. The revolution counter establishes the exposure. Record interruptions, an opening of the cover or any unusual movement. If one of two drums binds, keep its identity in the record so the other sample can be assessed on its own observations.
- Recover, inspect and reweigh. Transfer the contents carefully and examine the drum, projection and cover for a retained tablet or fragment. Record obvious cracking, cleavage or breakage and the location of smaller defects. Gently remove loose dust from the tablets as before and weigh the recovered test portion. Record the final mass and account for any material whose recovery was uncertain.
- Calculate and report the result. Subtract final mass from initial mass, divide by initial mass and multiply by 100. Keep full precision through the calculation and follow the product’s reporting rule at the end. Report the percentage alongside the post-test appearance, actual run settings, sample location and applicable criterion. A subsequent shift should be able to reconstruct the figure from the two original readings.
For example, if the balance record shows 6.500 g initially and 6.474 g afterward, the sample lost 0.026 g, or 0.40%. If the same starting mass ends at 6.433 g, the result is approximately 1.03%. Record each as observed. A result close to a limit warrants a check of units, significant figures and visual observations before the product procedure is applied. Neither the sampling estimate nor a theoretical batch weight belongs in the denominator.
Why Moisture and Dedusting Matter
Friability is calculated from a small change between two much larger weights. With a 6.500 g sample, 10 mg corresponds to about 0.15 percentage points. Tablets that pick up moisture between weighings can show an artificially small loss or even a net gain. The harmonized method calls for an appropriate humidity-controlled environment for hygroscopic tablets. Record the room condition and time out of the container where these affect the product. A second sample waiting uncovered while the first is weighed can have a different exposure history. Chewable and effervescent tablets may have their own friability specifications. For coated finished tablets, check the method for that stage. The guide to fabricação de comprimidos efervescentes explains where moisture enters the production process. [1]
Loose dust on incoming tablets is a separate source of error. If that dust stays on the tablets for the first weighing and comes off at the end, some of the reported loss occurred before the drum ever turned. Aggressive cleaning at the second weighing can produce a similar numerical effect. Use a consistent, gentle method at both points. If an edge breaks when a tablet is handled, record that event while the fragment and the place it broke are still identifiable.
When the final mass exceeds the starting mass, retain both raw readings and the resulting value. Check the unit and tare, the working surface and the length of each exposure to air. Then look at the other samples weighed in that interval. A change shared by several products points the investigation toward the setup. A change confined to one moisture-sensitive product calls for closer examination of its sampling and exposure history. The approved investigation determines the next action.
How a Friabilator Works After Tablet Compression
Inside the friabilator, a curved projection on the rotating drum carries tablets upward and releases them. The harmonized apparatus has a smooth interior, a diameter of 283–291 mm and a depth of 36–40 mm. Its removable side allows the operator to load and recover the sample. Looking through the transparent drum gives an immediate check on the exposure. A tablet repeatedly sliding at the bottom interacts with the equipment differently from one that rises and falls on each turn. [1]
The press performs an earlier job. Its punches compress material in a die, the lower punch raises the core for ejection, and the take-off guide directs it toward discharge. A core can be marked as it meets the guide or damaged at the first landing. A friabilator run on a separately identified outlet sample tests how the recovered cores withstand tumbling. The test record alone cannot identify which guide, chute or drop first damaged an edge.
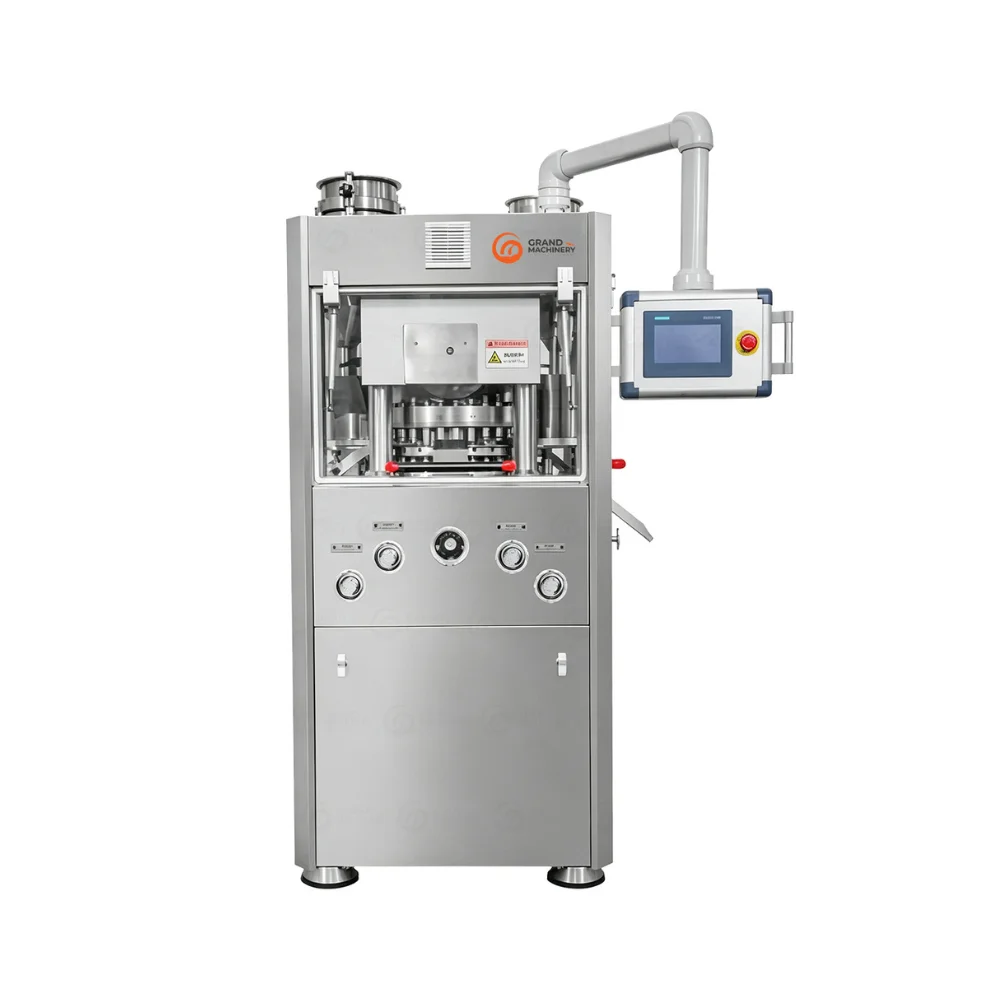
The GRAND ZPT420 prensa rotativa para comprimidos shown below is an example of the production equipment upstream of the test. When investigating an outlet sample, identify the actual take-off and collection point on the installed press. A sample scooped from the top of a partly filled bin has already undergone at least one additional handling step. Mark that difference on the sample label before comparing the result with an outlet reading.
Common Friability Problems and What to Check
Scroll sideways to read all three columns.
| Observação | Áreas a serem investigadas | Por que isso é importante |
|---|---|---|
| High loss, with worn or apparently intact edges | Loose dust, dedusting technique, tablet count, tare and fragments caught at the drum cover | An even band of dust suggests abrasion. Sharp edges and little dust make sample recovery and the original weights the first checks. |
| A chip on one rim or chips already at the coating inlet | Compare incoming cores at the outlet, first landing and coating inlet. Look for a mark that repeats beside the score. | A chip photographed on receipt predates the drum run. Its location can help trace a hard landing or guide contact. |
| A crack, detached crown or internal layers at low loss | Inspect both faces and the band. Compare retained outlet cores with the compression, tooling and ejection records. | A cap separates near a face. Lamination splits the core internally. An obvious crack, cleavage or break after tumbling fails the sample. |
| Tablets bind or results follow one drum or analyst | Observe the lift and fall. Check drum assembly, permitted tilt, dedusting and transfer technique. | The counter records revolutions. Tablets that ride together can receive different exposure even at the correct speed. |
| Apparent mass gain or a small, inconsistent loss | Review the raw readings, units, tare, balance status, humidity and time out of the container. | Moisture uptake or a weighing discrepancy can mask abrasion. Both original readings help distinguish the explanations. |
Use the first observable difference to decide where to look. For a recurring crown fracture, compare the compression interval and tooling records with retained outlet cores. For chips first seen after a bin transfer, inspect that transition under the loading conditions that actually occurred. The guide to defeitos em tablets gives more detail on the fracture patterns and the press components associated with them.
Quality Control Measurements for Tablet Friability
A friability result is most useful when another person can reconstruct it and distinguish a numerical excursion from a visibly failed sample. Record the following five groups of observations against the same batch and production interval.
- Sample identity and physical measurements. Record the unit weight used to select the count, the number tested, the collection point and the actual initial mass. Keep the relevant individual weights, tablet thickness and breaking-force records available. A combined sample weight can hide light and heavy individual tablets in the same group.
- Exposure and recovery. Record the instrument and drum, completed revolutions, speed, any permitted tilt and how the tablets moved. Account for the test portion at the end. A note that a chip was found at the cover helps the reviewer interpret a discrepancy that would otherwise appear only as a number.
- Initial weight, final weight and percentage lost. O tablet friability formula é mass loss (%) = [(initial mass − final mass) / initial mass] × 100. Use the same unit for both masses. A loss of 26 mg from 6,500 mg gives 0.40%, the same answer as using 0.026 g and 6.500 g. Preserve the raw figures even when the reported result is rounded.
- Visual integrity and complementary tests. Note how many units are affected where that can be established. Record an obvious crack even if a sample loses only 0.40%. A breaking-force measurement can help assess individual cores. Disintegration and content uniformity address different product attributes and require their own applicable tests. Improving the resistance of an edge calls for a check of the other attributes covered by the approved change.
- Criteria and disposition. The harmonized method generally uses one determination. If the result is difficult to interpret or the weight loss exceeds the target, it describes two further determinations and the mean of all three. For example, 1.20%, 0.84% and 0.90% average 0.98%. Retain all three observations, apply the visual failure rule and use the applicable product specification. Follow the site’s investigation procedure when a pharmaceutical specification is exceeded. [1] [5]
To read a developing trend, suppose comparable outlet samples give 0.28%, 0.31%, 0.59% and 0.61%. Examine the production interval between the second and third samples. A new material container, a change in press speed, a different sampling point or a change in dedusting could each affect the comparison. These are illustrative readings. The product specification and any established process alert limits determine the response.
Handling Tablet Cores Between the Press and Coater
To investigate a transfer, follow a defined portion of a batch from discharge to the coating inlet. Allow for travel and hold time. Name the exact point on each label, record whether the receiving bin was empty or partly filled, and inspect the incoming tablets before laboratory preparation. If damage first appears after a particular change of direction or drop, collect separately identified samples on both sides of that location. The guide to tablet coating defects continues the investigation for damage first seen during coating.
Consider a teaching example with 325 mg uncoated cores. At the press outlet the received tablets look intact. A test portion of 20 whole tablets weighs 6.510 g before tumbling and 6.484 g afterward, giving about 0.40% loss. After transfer, several cores in the material received at the coating inlet already show chipped rims. A separately identified portion of 20 whole tablets from this point weighs 6.492 g initially and 6.460 g afterward, giving about 0.49% loss. Write down the chips observed on receipt as well as the result for the whole tablets tested. The 0.09-percentage-point difference by itself cannot locate the damage.
For each point, start the production record with batch and sample ID with count, collection time and container, and the exact sampling point and incoming appearance. Add the initial and final masses, percentage lost, post-test appearance, applicable criterion, and follow-up with an owner. Photograph the first affected handoff while its configuration is still known. In a published study, Singhal and colleagues found that additional drop and impact tests distinguished the damage behavior of the formulations and shapes studied even though their compendial tests were satisfactory. That finding helps explain why a documented transfer event deserves its own investigation. [4]
How to Select a Friabilator for a Tablet Press Line
Start with the tablets and the decisions the laboratory must support. A line making one round core for routine checks has a different sampling workload from a development laboratory comparing several shapes, sampling points and press settings. Use the approved test method and the intended workload to evaluate an instrument.
- Applicable method and drum. Confirm the drum geometry, internal finish, curved projection and removable cover against the method in use. Ask how those characteristics are checked after a drum is replaced.
- Tablet size, shape and motion. Bring representative whole cores where a demonstration is available. Observe whether the tablets tumble freely and establish how a permitted change in orientation will be set and documented.
- Speed and completed revolutions. Confirm how the analyst selects the run, sees the completed count and identifies an interruption. Review the site’s means of verifying actual speed and rotation count during routine operation.
- Sample throughput and identification. Estimate how often the press outlet, holding and coating samples arrive together. Multiple drums can run separate samples at the same time. Each drum needs an unambiguous link to its own count, weighings and appearance record. [1]
- Recovery and cleaning. Examine access to the drum, cover and transfer vessel. An operator should be able to see a retained fragment and clean the equipment between samples using the approved procedure.
- Balance and room conditions. Confirm the weighing arrangement, the availability of the required humidity control and the distance between drum and balance. A compact bench layout helps keep exposure time and tablet transfers consistent.
- Records and maintenance support. Identify how the laboratory preserves original readings, associates them with a batch and records service or replacement of a drum. Compare the available support and verification instructions with the site’s operating and documentation needs.
When the recurring issue is damage at the press outlet, the equipment discussion should include the press, take-off, chute and receiving container. If a joint repeatedly marks the same edge, use a matched sample upstream and downstream to evaluate a change at that joint. If the damage is first seen after an instrument change, bring the old and new drum identities and the matched sample records to the laboratory review.
Perguntas frequentes
How many tablets should go in a friabilator?
For tablets weighing 650 mg or less each, choose whole tablets with a combined mass as close as possible to 6.5 g. For a 400 mg tablet, 16 tablets give 6.4 g, the closer count. Above 650 mg per tablet, use ten whole tablets. [1]
Why can a tablet crack even when weight loss is low?
A crack can run through a core while the two sides stay together. Almost all the mass is still on the balance. Under the harmonized method, an obviously cracked, cleaved or broken tablet after tumbling fails the sample, even at 0.40% loss. Record both findings. [1]
Does a high-output press need a dual-drum friabilator?
That depends on how many samples reach the laboratory at the same time. Two drums can test a press-outlet sample and a coating-inlet sample together. Give each portion its own sample ID, initial and final weights, and visual inspection record. [1]
How does tablet friability differ from tablet hardness?
Where should we sample if tablets chip before coating?
Start at the press outlet and the coating inlet, allowing for the time that the same material spends in transit. Photograph the cores as they arrive at each point. If the first sample is intact and the second already has chips, check the chute, receiving bin and transfers between them.
Conclusão
Record the starting and final masses, the motion in the drum and what the tablets looked like before and after the run. At the press, give the sample a precise location. At the coater, check whether the arriving cores are already chipped. Together those observations let production and quality staff decide whether their next check belongs at the weighing bench, the press or a particular transfer point.
Discuss a press-outlet problem with GRAND Machinery. If cores repeatedly lose an edge between take-off and the first bin, bring the product shape, a photograph of the damaged side, the discharge arrangement and the two sampling records. Contact the GRAND tablet press team to review that part of the line.
Referências técnicas
- World Health Organization. The International Pharmacopoeia, 13th edition (2025), section 10.4.5, Tablet friability.
- United States Pharmacopeia. General Chapter 〈1216〉, Tablet Friability. USP–NF. DOI 10.31003/USPNF_M99935_01_01.
- International Council for Harmonisation. Q6A, Specifications, Test Procedures and Acceptance Criteria for New Drug Substances and New Drug Products. Section 2.3, In-Process Tests. U.S. Food and Drug Administration.
- Singhal M, Sorjonen J, Wikström H, et al. Exploring the impact of formulation and tablet shape on tablet integrity: A comprehensive investigation using mechanical and imaging techniques. Journal of Pharmaceutical Sciences, 2025, 114(7), article 103832. DOI 10.1016/j.xphs.2025.103832.
- U.S. Food and Drug Administration. Investigating Out-of-Specification (OOS) Test Results for Pharmaceutical Production. Guidance for Industry, May 2022, section IV.B.1 on retesting.